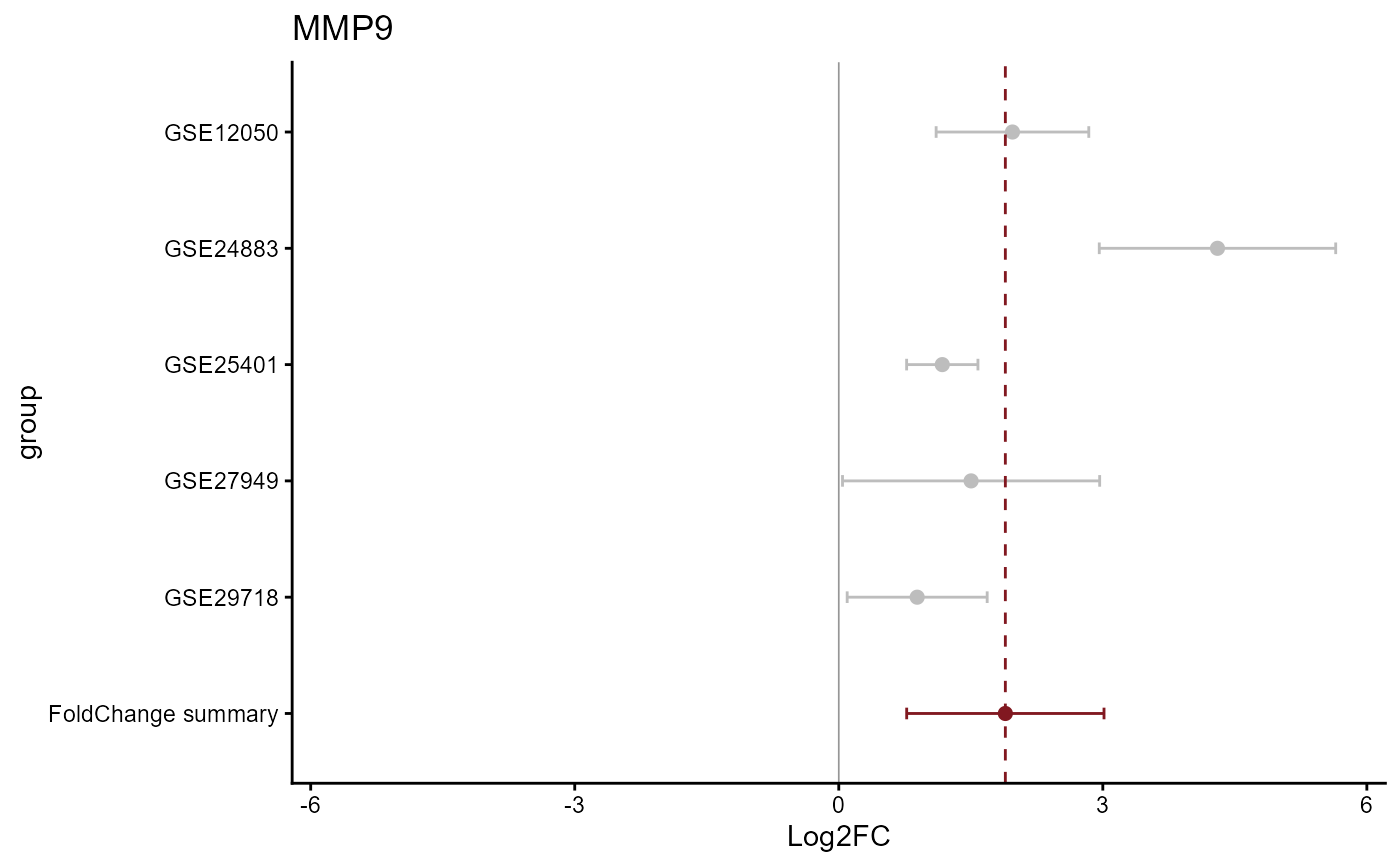
A function to draw a forest plot from the REM MetaVolcano result
Source:R/draw_forest.R
draw_forest.RdThis function draws a forest plot for a given gene based on the REM MetaVolcano result
draw_forest(
  remres,
  gene = "MMP9",
  genecol = "Symbol",
  foldchangecol = "Log2FC",
  llcol = "CI.L",
  rlcol = "CI.R",
  jobname = "MetaVolcano",
  outputfolder = tempdir(),
  draw = "PDF",
  colors = c(positive = "#811820", negative = "#083e46", neutral = "#bdbdbd", reference =
    "#969696"),
  point_size = 2,
  plot_width = 4,
  plot_height = 5,
  plot_title = NULL
)
Arguments
- remres
MetaVolcano object. Output of the rem_mv() function <MetaVolcano>
- gene
query gene to plot
- genecol
name of the variable with genes <string>
- foldchangecol
the column name of the foldchange variable <string>
- llcol
left limit of the fold change coinfidence interval variable name <string>
- rlcol
right limit of the fold change coinfidence interval variable name <string>
- jobname
name of the running job <string>
- outputfolder
/path where to write the results/ <string>
- draw
either 'PDF' or 'HTML' to save metaolcano as .pdf or .html respectively <string>
- colors
named vector of colors: c(positive, negative, neutral)
- point_size
size of the points
- plot_width
width of saved plot (inches for PDF, pixels for HTML)
- plot_height
height of saved plot (inches for PDF, pixels for HTML)
- plot_title
custom plot title (defaults to gene name)
Value
ggplot2 object
Examples
data(diffexplist)
diffexplist <- lapply(diffexplist, function(del) {
    dplyr::filter(del, grepl("MP", Symbol))
})
mv <- rem_mv(diffexplist, metathr = 0.1)
#>   index   Symbol   Log2FC_1      CI.L_1     CI.R_1       vi_1   Log2FC_2
#> 1   222  WHAMMP3         NA          NA         NA         NA         NA
#> 2   160  PRIMPOL -0.3378182 -0.54408906 -0.1315473 0.01107551 -0.2480139
#> 3   118     MPDZ -0.9249348 -1.32891570 -0.5209538 0.04248245 -0.6006522
#> 4   113     MMP9  1.9734811  1.10629763  2.8406646 0.19575364  4.3029552
#> 5     7    AMPD3  0.3697135 -0.04744253  0.7868695 0.04529861  0.6110937
#> 6   123 MPHOSPH8 -0.2116034 -0.69279528  0.2695885 0.06027323 -0.3439310
#>       CI.L_2      CI.R_2       vi_2   Log2FC_3     CI.L_3     CI.R_3
#> 1         NA          NA         NA -0.2662587 -0.3756295 -0.1568878
#> 2 -0.5164661  0.02043827 0.01875952 -0.2291284 -0.3542972 -0.1039597
#> 3 -1.0368339 -0.16447051 0.04952480 -0.2656371 -0.3954003 -0.1358739
#> 4  2.9598690  5.64604138 0.46956488  1.1760710  0.7709121  1.5812299
#> 5 -0.1360695  1.35825696 0.14531781  0.3667739  0.2264579  0.5070899
#> 6 -1.0921449  0.40428288 0.14572679 -0.2283827 -0.3450875 -0.1116780
#>          vi_3   Log2FC_4      CI.L_4      CI.R_4       vi_4    Log2FC_5
#> 1 0.003113802 -0.7385719 -1.30691156 -0.17023224 0.08408214 -0.17550424
#> 2 0.004078305 -0.1327384 -0.94702910  0.68155240 0.17260241 -0.14117164
#> 3 0.004383199 -0.6311629 -1.25072021 -0.01160553 0.09991964 -0.29038789
#> 4 0.042730559  1.5033808  0.04244132  2.96432037 0.55558733  0.89087042
#> 5 0.005125100  0.6016498  0.09670185  1.10659777 0.06637142  0.06306675
#> 6 0.003545399 -0.2829139 -0.65710336  0.09127559 0.03644777 -0.18637598
#>        CI.L_5       CI.R_5       vi_5 signcon ntimes randomSummary randomCi.lb
#> 1 -0.43754481  0.086536319 0.01787413      -3      3    -0.2676471  -0.3670301
#> 2 -0.36818515  0.085841876 0.01341502      -5      5    -0.2370264  -0.3275163
#> 3 -0.57577956 -0.004996212 0.02120169      -5      5    -0.4895761  -0.7484198
#> 4  0.09550763  1.686233209 0.16467148       5      5     1.8926666   0.7716524
#> 5 -0.23887025  0.365003741 0.02373124       5      5     0.3342331   0.1726908
#> 6 -0.46537657  0.092624617 0.02026274      -5      5    -0.2282194  -0.3284609
#>   randomCi.ub      randomP     het_QE      het_QEp   het_QM      het_QMp error
#> 1  -0.1682641 1.303486e-07  3.1131661 0.2108553240 27.86103 1.303486e-07 FALSE
#> 2  -0.1465364 2.838513e-07  1.6869040 0.7930951263 26.35657 2.838513e-07 FALSE
#> 3  -0.2307325 2.096707e-04 11.6306553 0.0203199220 13.74237 2.096707e-04 FALSE
#> 4   3.0136809 9.359335e-04 22.3694375 0.0001691819 10.95020 9.359335e-04 FALSE
#> 5   0.4957755 5.009352e-05  4.9282575 0.2947382538 16.44457 5.009352e-05 FALSE
#> 6  -0.1279779 8.110647e-06  0.2649513 0.9919628997 19.91161 8.110647e-06 FALSE
#>   randomP.adjust         se rank
#> 1   2.906774e-05 0.05070560    1
#> 2   3.164942e-05 0.04616834    2
#> 3   4.675656e-03 0.13206308    3
#> 4   1.605486e-02 0.57194604    4
#> 5   1.595836e-03 0.08241956    5
#> 6   6.028914e-04 0.05114362    6
gg <- draw_forest(mv, gene="MMP9")
plot(gg)