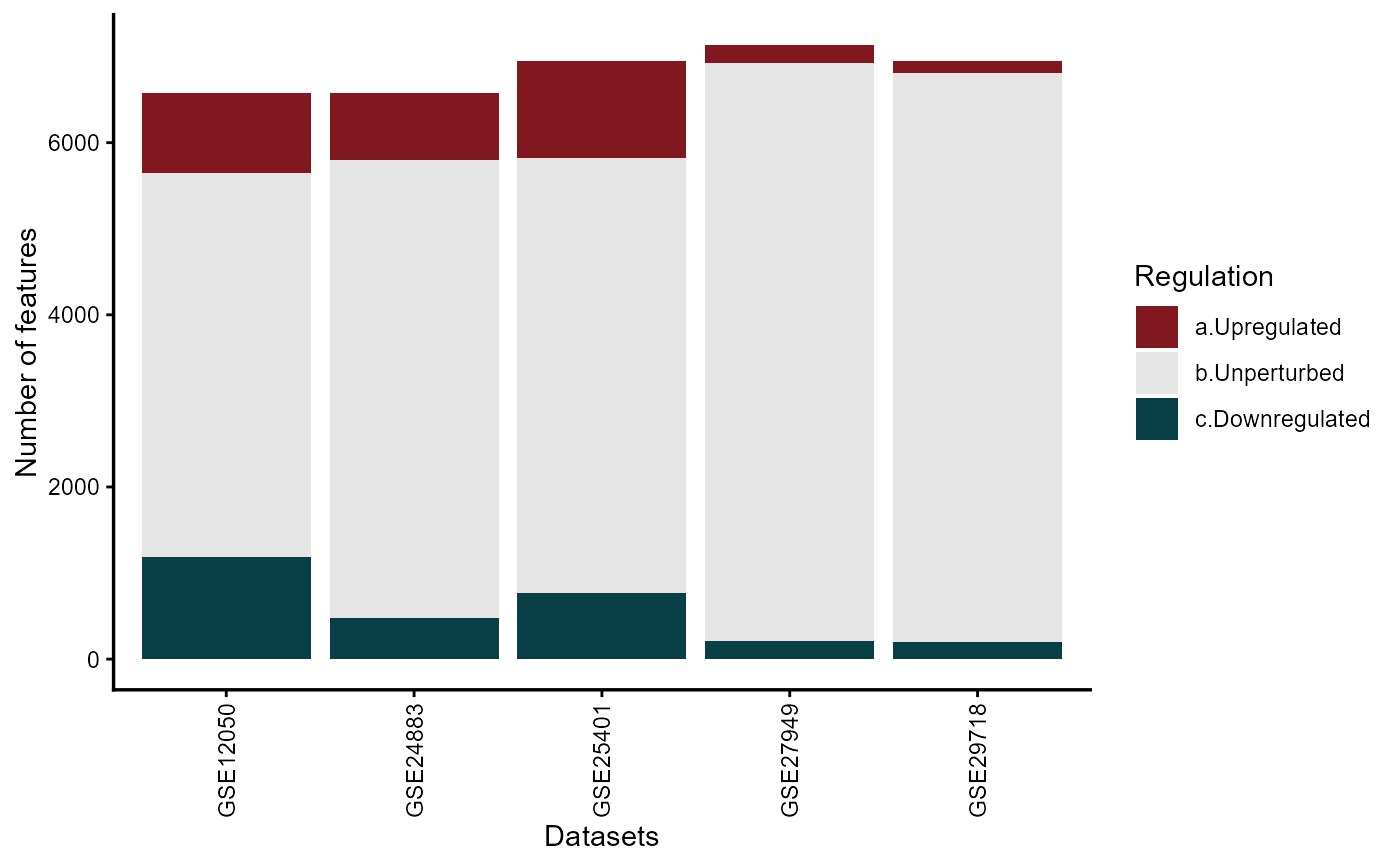
This function visualize as barplots the number of features across the input studies
draw_featurebar(degbar_data, colors = c("#811820", "grey90", "#083e46"))Arguments
- degbar_data
output of the
set_degbar_data()function <data.fram/data.table>
Value
ggplot2 object
Examples
data(diffexplist)
diffexp <- lapply(diffexplist, function(...) deg_def(..., "pvalue",
           "Log2FC", 0.05, 0))
bardat <- set_degbar_data(diffexp)
gg <- draw_featurebar(bardat)
plot(gg)