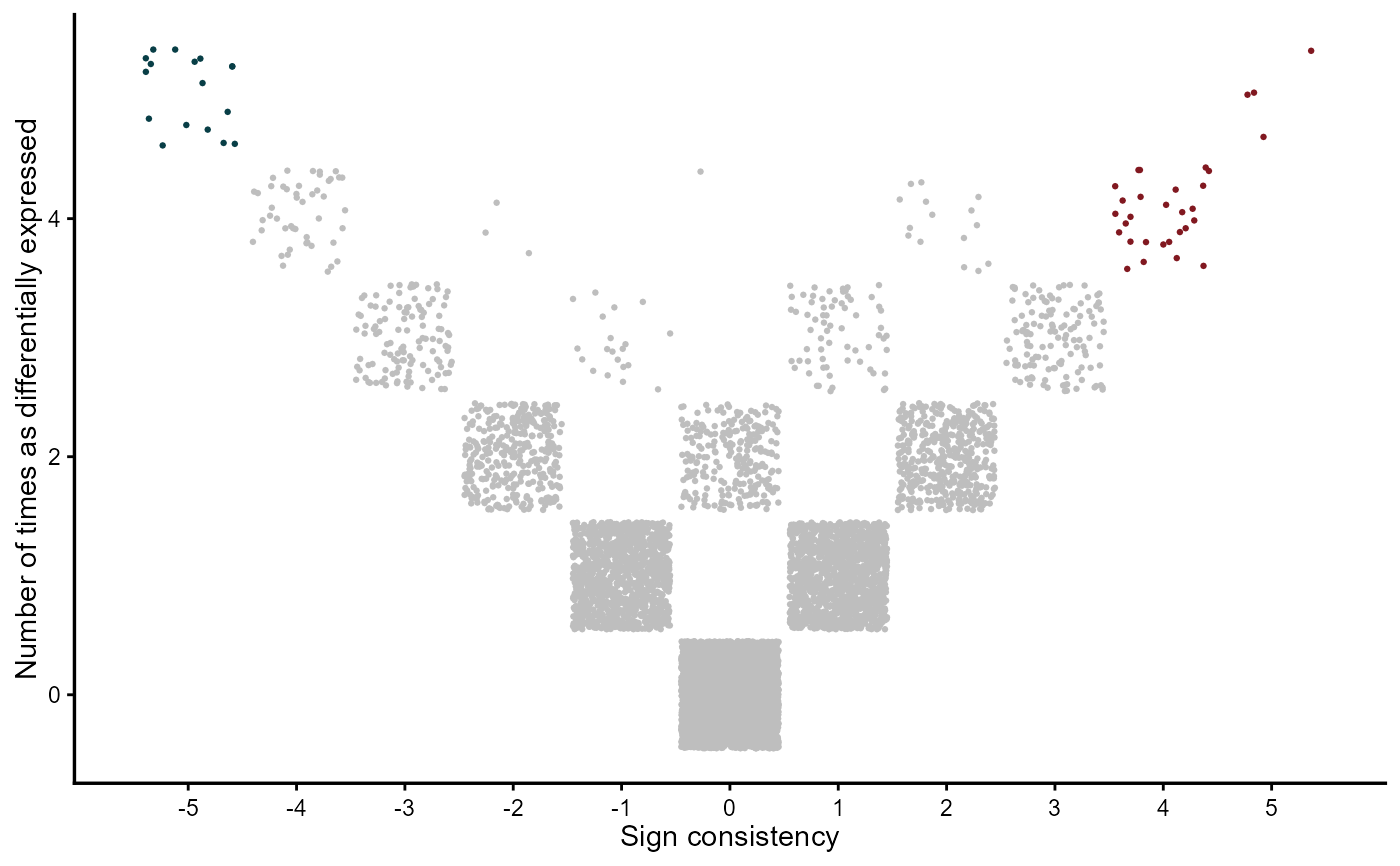
This function plots either the combining- or the vote-counting- MetaVolcanos
plot_mv(
  meta_diffexp,
  nstud,
  genecol,
  comb,
  metafc,
  colors = c("#083e46", "grey", "#811820"),
  point_size = 0.5,
  label_genes = NULL,
  label_top_n = NULL,
  label_size = 3,
  plot_title = NULL,
  show_legend = FALSE
)
Arguments
- meta_diffexp
data.frame/data.table containing the differential expression inputs
- nstud
the number of differential expression inputs <integer>
- genecol
column name of the variable to label genes in the .html file <string>
- comb
wheather or not the drawing is for the combining-metavolcano <logical>
- metafc
method for summarizing gene fold-changes across studies c("Mean", "Median") <string>
- colors
vector of colors for the plot
- point_size
size of the points
- label_genes
character vector of specific genes to label
- label_top_n
number of top genes to label
- label_size
size of gene labels
- plot_title
custom plot title
- show_legend
whether to show the legend
Value
ggplot2 object
Examples
data(diffexplist)
mv <- votecount_mv(diffexplist)
gg <- plot_mv(mv@metaresult, length(diffexplist), "Symbol", FALSE, "Mean")
plot(gg)