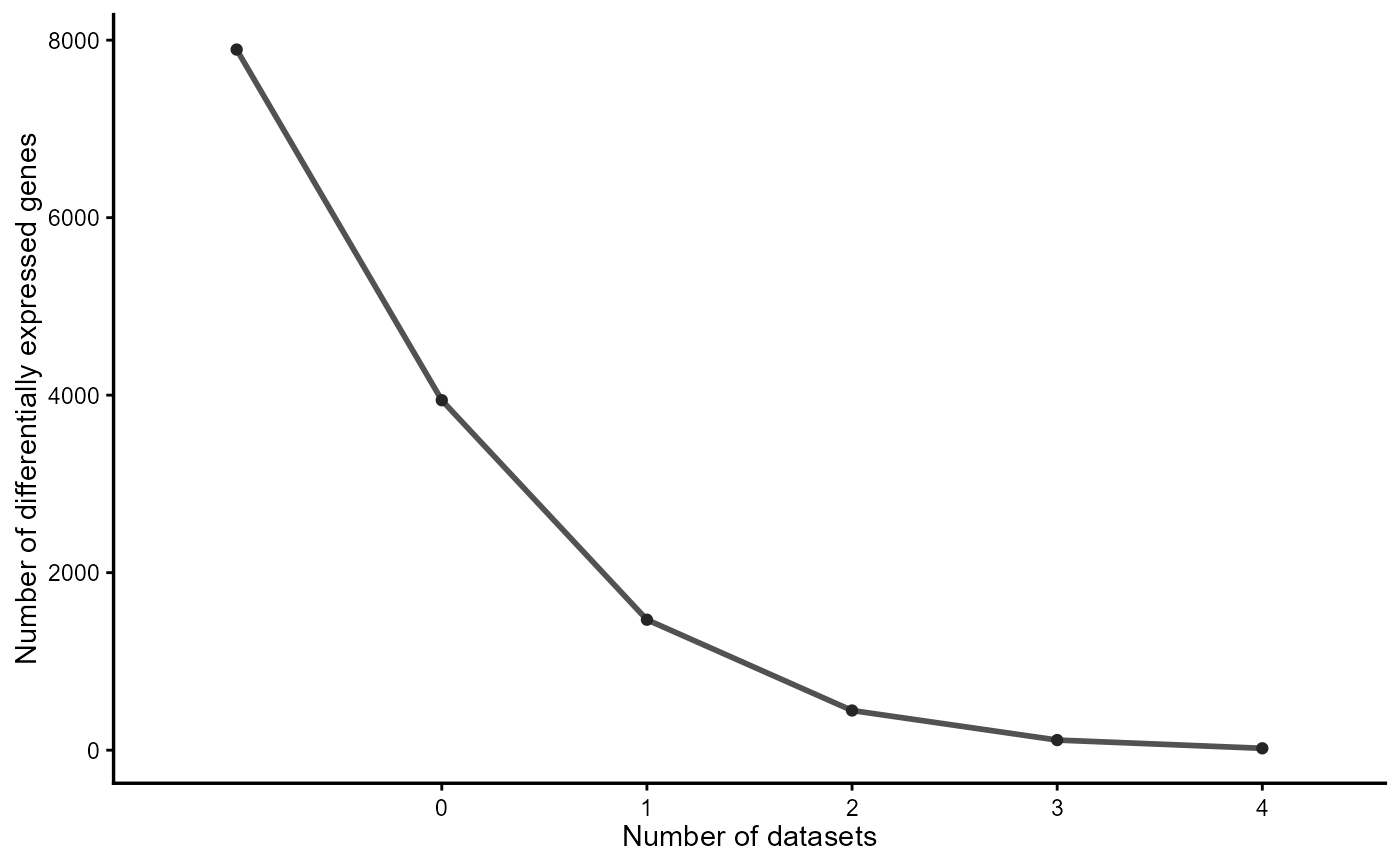
A function to visualize the inverse-cummulative DEG distribution
Source:R/draw_cum_freq.R
draw_cum_freq.RdThis function create a ggplot object with the inverse-cummulative DEG distribution
draw_cum_freq(meta_diffexp, nstud)Arguments
Value
ggplot2 object
Examples
library(dplyr)
data(diffexplist)
diffexp <- lapply(diffexplist, function(...) deg_def(..., "pvalue",
           "Log2FC", 0.05, 0))
diffexp <- rename_col(diffexp, "Symbol")
meta_diffexp <- Reduce(function(...) merge(..., by = "Symbol", all = TRUE),
           diffexp)
meta_diffexp %>%
dplyr::select(dplyr::matches("deg_")) %>%
    data.matrix -> n_deg
meta_diffexp[['ndeg']] <- rowSums(n_deg^2, na.rm = TRUE)
gg <- draw_cum_freq(meta_diffexp, length(diffexplist))
plot(gg)